History of Earthquake Prediction Research
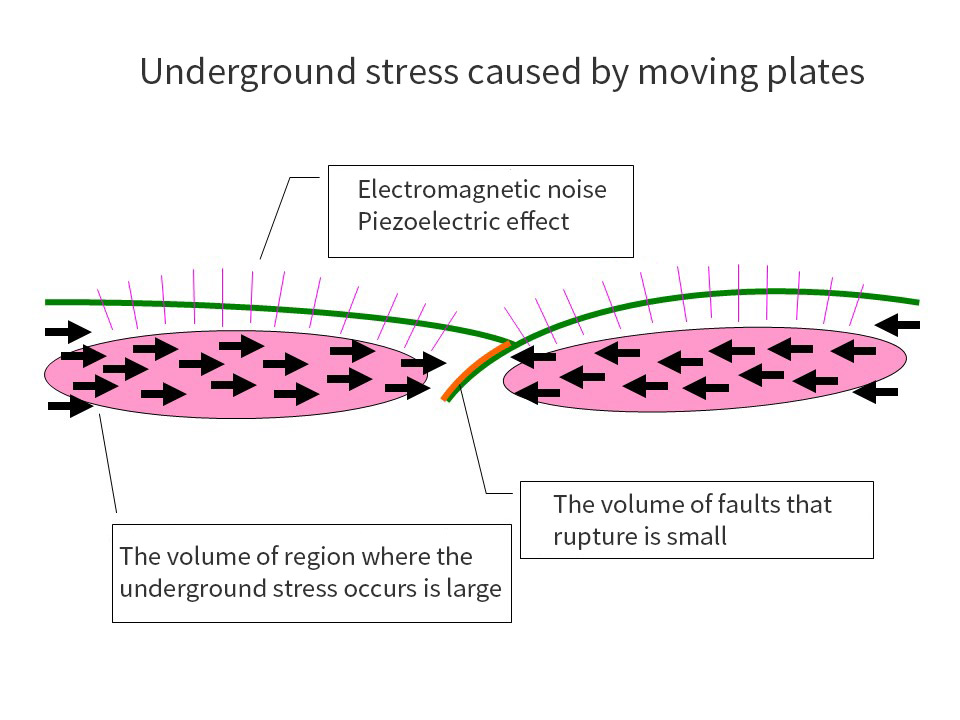
The Great Hanshin and Awaji Earthquake (M7.3, Max. seismic intensity level 7) occurred on January 17, 1995, with the focus of the epicenter located in Hyogo Prefecture. Many buildings including highways were destroyed, and its devastating damage claimed more than 6,000 lives. This earthquake made us realize that even in regions where the predicted occurrence rate was extremely low, there is always the possibility of massive earthquakes that can bring about vast and serious damage.
Immediately after the big earthquake in February 1995, our company hosted an inter-industry event. During this meeting, many cases of “Noise in radio waves” were brought up, such as an atomic clock that had become inaccurate just before the earthquake occurred, a driver who was on the Hanshin Expressway had complained about the noise on his AM radio, etc. Also, there was an introduction to a research paper written by a Japanese seismologist about “Electromagnetic anomalies for earthquake predictions,” which was published in an English Journal, “Nature vol.347, No.6291, Sept.1990.”
According to the research paper, electromagnetic radiation waves were released from minerals by an increase in underground pressure before large earthquakes. Collecting and observing these electromagnetic signals might allow us to predict the time when earthquakes are about to happen.
The members of the inter-industry group, mainly consisting of engineers, visited the seismologist’s office immediately after reading the article, and they started the research on earthquake predictions that uses electromagnetic signals after concluding an agreement to receive technical support from the seismologist.
Development of “Reverse Radio”
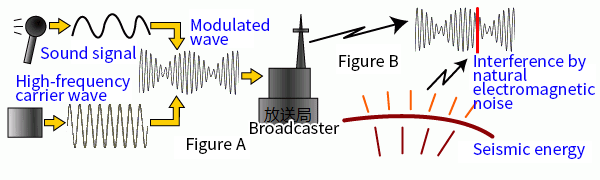
You must have encountered a situation in which your radio transmission got interrupted by noise when there was a thunderstorm. That noise actually is what the electromagnetic signals sound like.
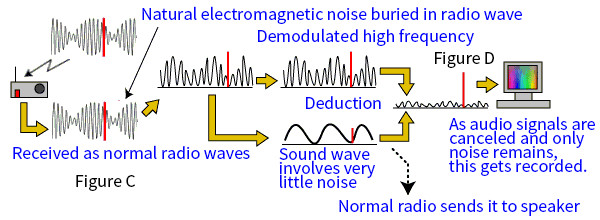
This electromagnetic noise could easily be detected if there was an open frequency that is not occupied for radio broadcasting or wireless communications. Unfortunately, most of the frequencies are currently used for some kind of broadcasting or communications. Although humans can detect the difference between the artificial signals and the electromagnetic noise that is an earthquake precursor, it is extremely difficult to automatically identify them.
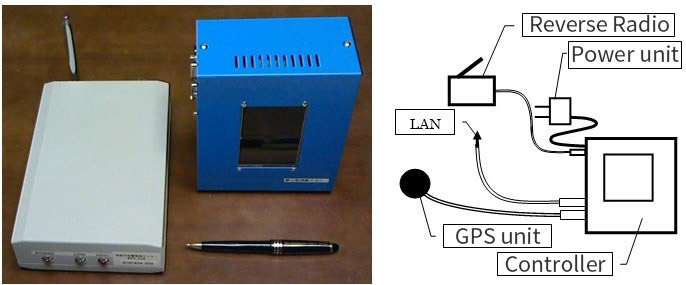
The “Reverse Radio” equipment, which is developed by our company, automatically identifies natural electromagnetic noise and separates it from other noise from an artificial origin such as broadcasting and communications by canceling them. We acquired a patent in 2001.
After that, our company developed a higher-accuracy reverse radio system, which allowed the steady collection of electromagnetic noise from the observation points throughout Japan. We also succeeded in finding a correlation between past earthquake occurrences and electromagnetic noise data. The statistical analysis of the data allowed us to perform more accurate earthquake predictions.
Currently, our company releases weekly earthquake predictions in Japan, with an accuracy rate of 70-80%.
Electromagnetic Noise Released Before Earthquakes
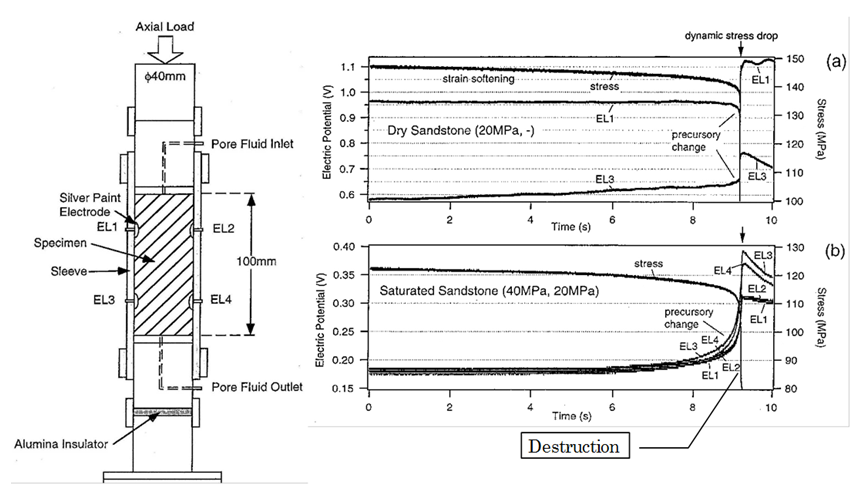
Why is electromagnetic noise released before earthquakes? It is necessary to destroy rocks to find out how strong the electromagnetic noise can be as an experiment, just so we can create the same conditions of an earthquake. Many researchers all over the world did experiments on destroying rocks, but here is one example of such an experiment conducted by Dr. Shingo Yoshida of Tokyo University shown in the figure below called “Saturated sandstone compression experiment data.”
(From research letters “Comprehensive research related to seismicity and physical processes,” “Electric potential changes prior to a shear fracture in dry and saturated rocks” Shingo Yoshida et al 1998/10.)
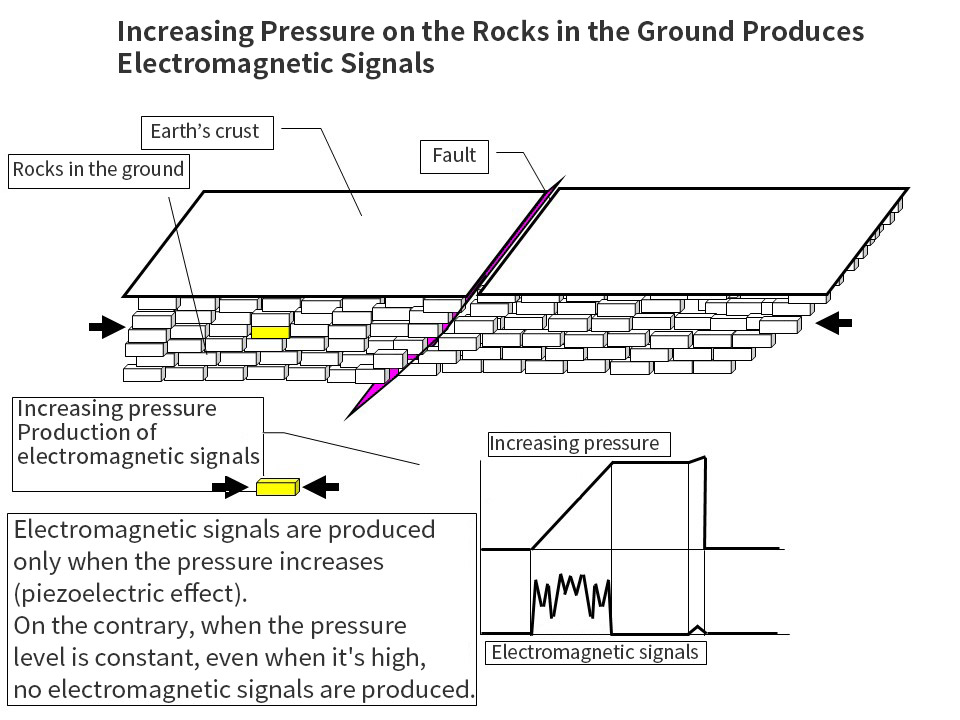
Experiment on Earth Currents/Voltages:A Rock that is 10 km in Size Can Produce 10,000-Volt Earth Electricity Before it Ruptures!
When a saturated sandstone specimen with a diameter of 4 cm and a length of 10 cm was pressurized, 0.1 - 0.3 V of electric voltage was generated just before the specimen ruptured. The research indicated that saturated, quartz-free basalt also produced 1/10 of the electric voltage stated above, due to water movement. When a 10 cm-long rock specimen produces 0.1 V of electric voltage, a rock that is 10 km by 10 km in size would produce 10,000 V of electric voltage.
Of course, electric voltage is only produced when the amount of pressure applied to the sandstone increases. If the pressure remains at a fixed level, even if the level is high, the electrical charges will not be produced.
A 10 cm sample produces 0.1 volt → When the pressurized area is 10 km before an earthquake, 10,000 volts will be produced!
Cause and Trends of Earth Currents/Voltages
According to experiments conducted by other researchers than the one mentioned above, there is a strong correlation between micro cracks (destruction/deformation of micro molecular structure) in the rocks getting filled with increasing pressure and water movements with an electric current produced concurrently.
If this is the case, if all the cracks are filled and the water gets pushed out, it will not be able to go any further and it is quite possible that no electric voltage will be produced even when more pressure is applied.
In reality, the trends in which the amount of noise detected on Reverse Radio show that most of the earthquakes occurred after the amount of noise that gradually increased every day reached the peak, started to decline and then became hardly undetectable (called settlement of data). Most cases show that fault planes moved after the settlement causing earthquakes. Because of this, the total amount of noise before and after the peak is considered proportional to the size of the entire rocks on which pressure is applied. This allows us to estimate the magnitude of the earthquake that is about to occur, and depending on the situation with the settlement of data, it is highly possible that its timing can also be predicted.
Earth Currents/Many Types of Electric Currents and Earthquake Predictions with Electromagnetic Signals
Although many seismologists who study earthquake predictions use earth currents and electromagnetic signals, false detections are also very common. Artificial frequencies/electromagnetic signals such as trains can alternate earth currents, and broadcasting and communications could interfere with the signals.
By developing the “Reverse Radio” system, our company succeeded in canceling signal waves that are created by broadcasting transmissions and in only extracting natural electromagnetic noise. This allowed us to make the most of earthquake predictions highly successful.
Currently, our company releases weekly earthquake predictions throughout the country, with an accuracy rate of 70-80%.